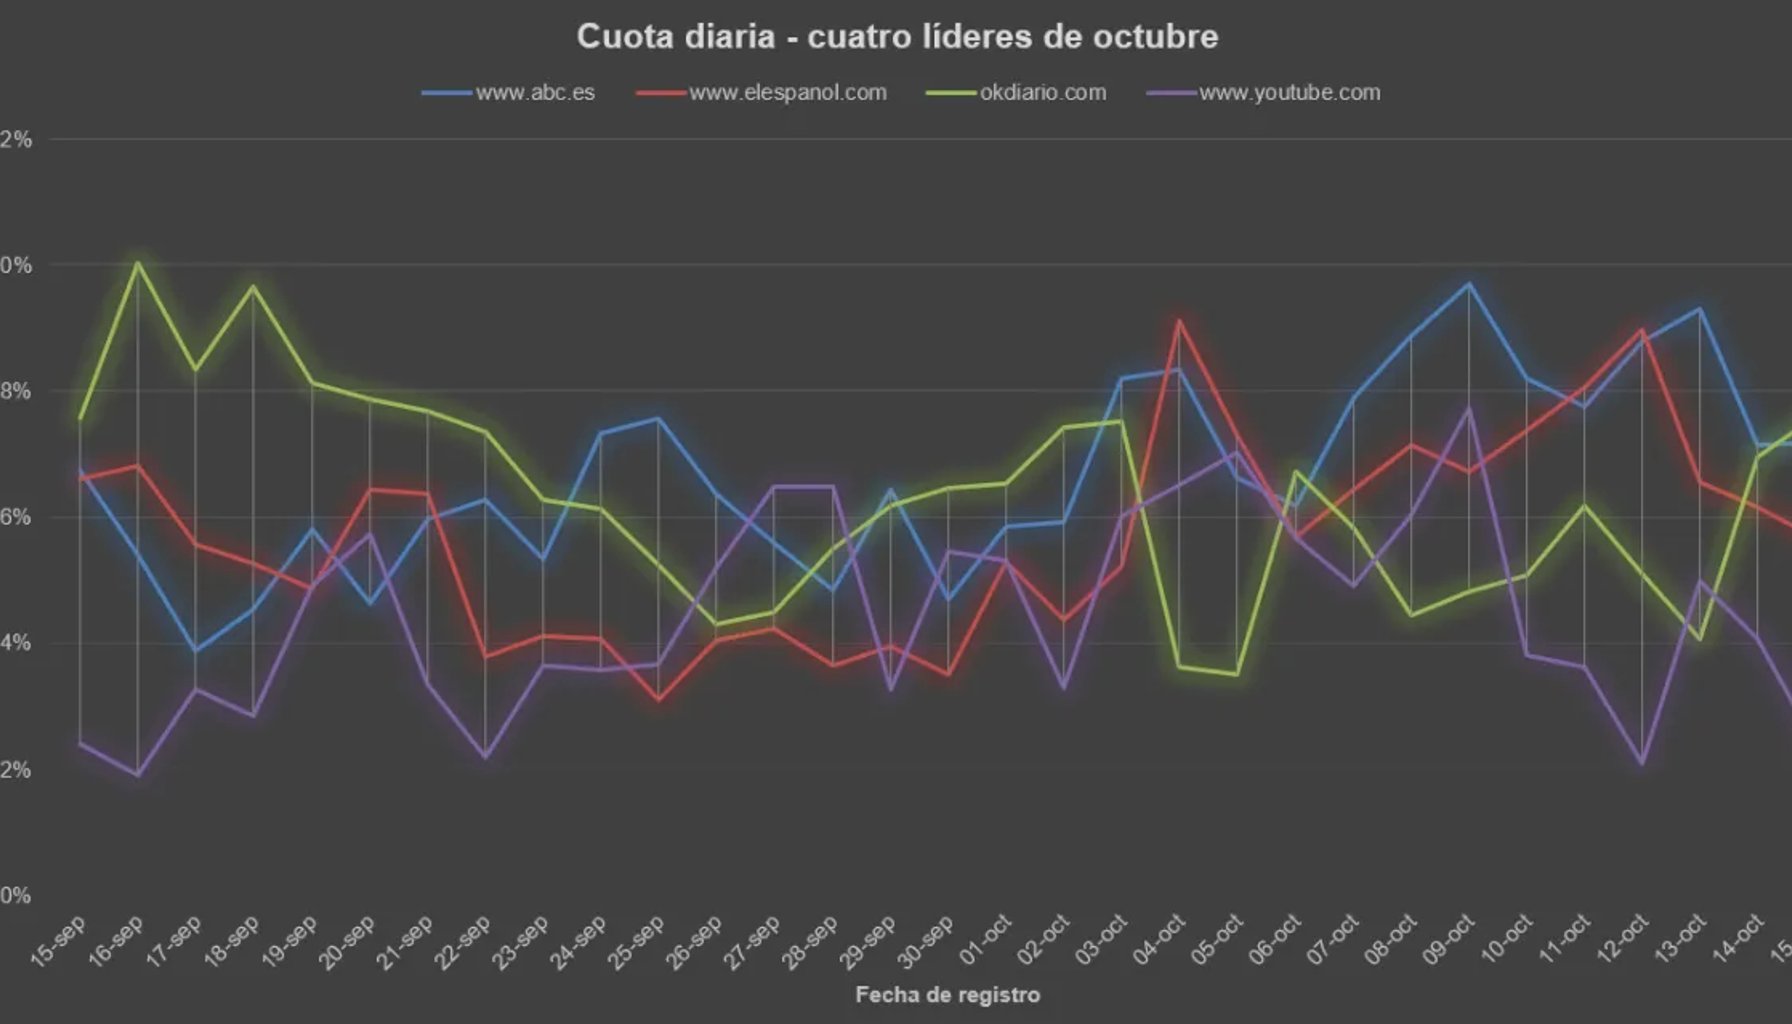
The analysis compares recorded appearances across the two periods. It measures relative visibility within the sample. It does not measure clicks, impressions or actual traffic.
The biggest changes among sites
ABC reaches an average share of 7.732% in the October period, followed by El Español (6.671%) and Okdiario (5.688%). The tables show the five largest gains and losses. The difference is expressed in percentage points (pp), not as a relative percentage change. For example, a rise from 5.713% to 7.732% is +2.019 pp.
| Site (source domain) | Sep. 15–30 | Oct. 1–15 | Change (pp) |
|---|---|---|---|
| ABC — www.abc.es | 5.713% | 7.732% | +2.019 |
| ElEspañol — www.elespanol.com | 4.770% | 6.671% | +1.900 |
| Infobae — www.infobae.com | 2.460% | 3.635% | +1.175 |
| YouTube — www.youtube.com | 4.020% | 4.897% | +0.877 |
| Las Provincias — www.lasprovincias.es | 0.369% | 0.964% | +0.595 |
| Site (source domain) | Sep. 15–30 | Oct. 1–15 | Change (pp) |
|---|---|---|---|
| Okdiario — okdiario.com | 6.947% | 5.688% | -1.259 |
| El País — elpais.com | 3.407% | 2.234% | -1.172 |
| El Mundo — www.elmundo.es | 5.133% | 4.009% | -1.123 |
| El Confidencial — www.elconfidencial.com | 4.205% | 3.367% | -0.838 |
| Vanitatis — www.vanitatis.elconfidencial.com | 2.066% | 1.431% | -0.635 |
Among the top 20, the 18 outlets that appear in both periods also change rank. In October, 20minutos and El Economista enter, while ¡HOLA! and La Vanguardia leave. Across all sites, 27 changes reach at least 0.250 pp in absolute terms. Labels are retained as they appear in the data; domain variants, subdomains and brand names are not automatically consolidated.
LATAM: virtually no change in aggregate share
The aggregate share of outlets classified as LATAM moves from 7.6143% to 7.6127%, a difference of -0.0016 pp. The change is minimal, leaving the visibility share of Latin American outlets in Google Discover Spain essentially stable.
Individual outlets move in different directions: Infobae gains ground, while La Nación, El Cronista, Clarín and TyC Sports decline in this sample.
For El Cronista, the period average masks an uneven daily distribution. Visibility is concentrated at the start; the outlet is almost entirely absent from the sample between September 17 and 29, then reappears with five recorded appearances on September 30.
| Site (source domain) | Sep. 15–30 | Oct. 1–15 | Change (pp) |
|---|---|---|---|
| Infobae — www.infobae.com | 2.460% | 3.635% | +1.175 |
| La Nación — www.lanacion.com.ar | 1.824% | 1.208% | -0.616 |
| El Cronista — www.cronista.com | 0.697% | 0.341% | -0.356 |
| Clarín — www.clarin.com | 0.614% | 0.399% | -0.215 |
| TyC Sports — www.tycsports.com | 0.261% | 0.109% | -0.152 |
The sections with the biggest changes
Section labels come from the original data and do not form a harmonized topic taxonomy. Empty values are normalized to «(sin sección)», while all other labels are retained after trimming whitespace.
The curiosidades section loses share but remains one of the largest; international news also declines. Video, celebrity and entertainment content gains ground.
| Section label | Sep. 15–30 | Oct. 1–15 | Change (pp) |
|---|---|---|---|
| curiosidades | 3.455% | 2.364% | -1.091 |
| watch | 3.977% | 4.891% | +0.914 |
| internacional | 1.785% | 1.024% | -0.761 |
| es | 2.941% | 2.323% | -0.618 |
| gente | 0.940% | 1.540% | +0.600 |
| corazon | 0.433% | 1.015% | +0.582 |
What the sample includes
The analysis used 25,092 appearances per period. Repeated appearances of the same URL in a city on a given day were retained. Repetition may reflect persistence in the sample, so it is not treated as a duplicate.
How visibility was calculated
Each appearance is weighted according to its position: 1 / log2(position + 1). For each city and day, the weights for each entity are summed and divided by the total weight for that city-day set. All days are then averaged, including those on which an entity does not appear. The final figure is therefore an equally weighted average across cities and days.
Scope and limitations
As a sensitivity check, a second analysis retained only one appearance per URL, date and city, using the best observed rank. Under this variant, all 27 major changes of at least 0.250 pp retain their direction.
These results describe relative visibility in a sample, not traffic, clicks, impressions or the literal duration of an appearance. No significance tests or population-level confidence intervals were calculated, and the comparison cannot attribute the changes to a Google update, penalty or any other cause.