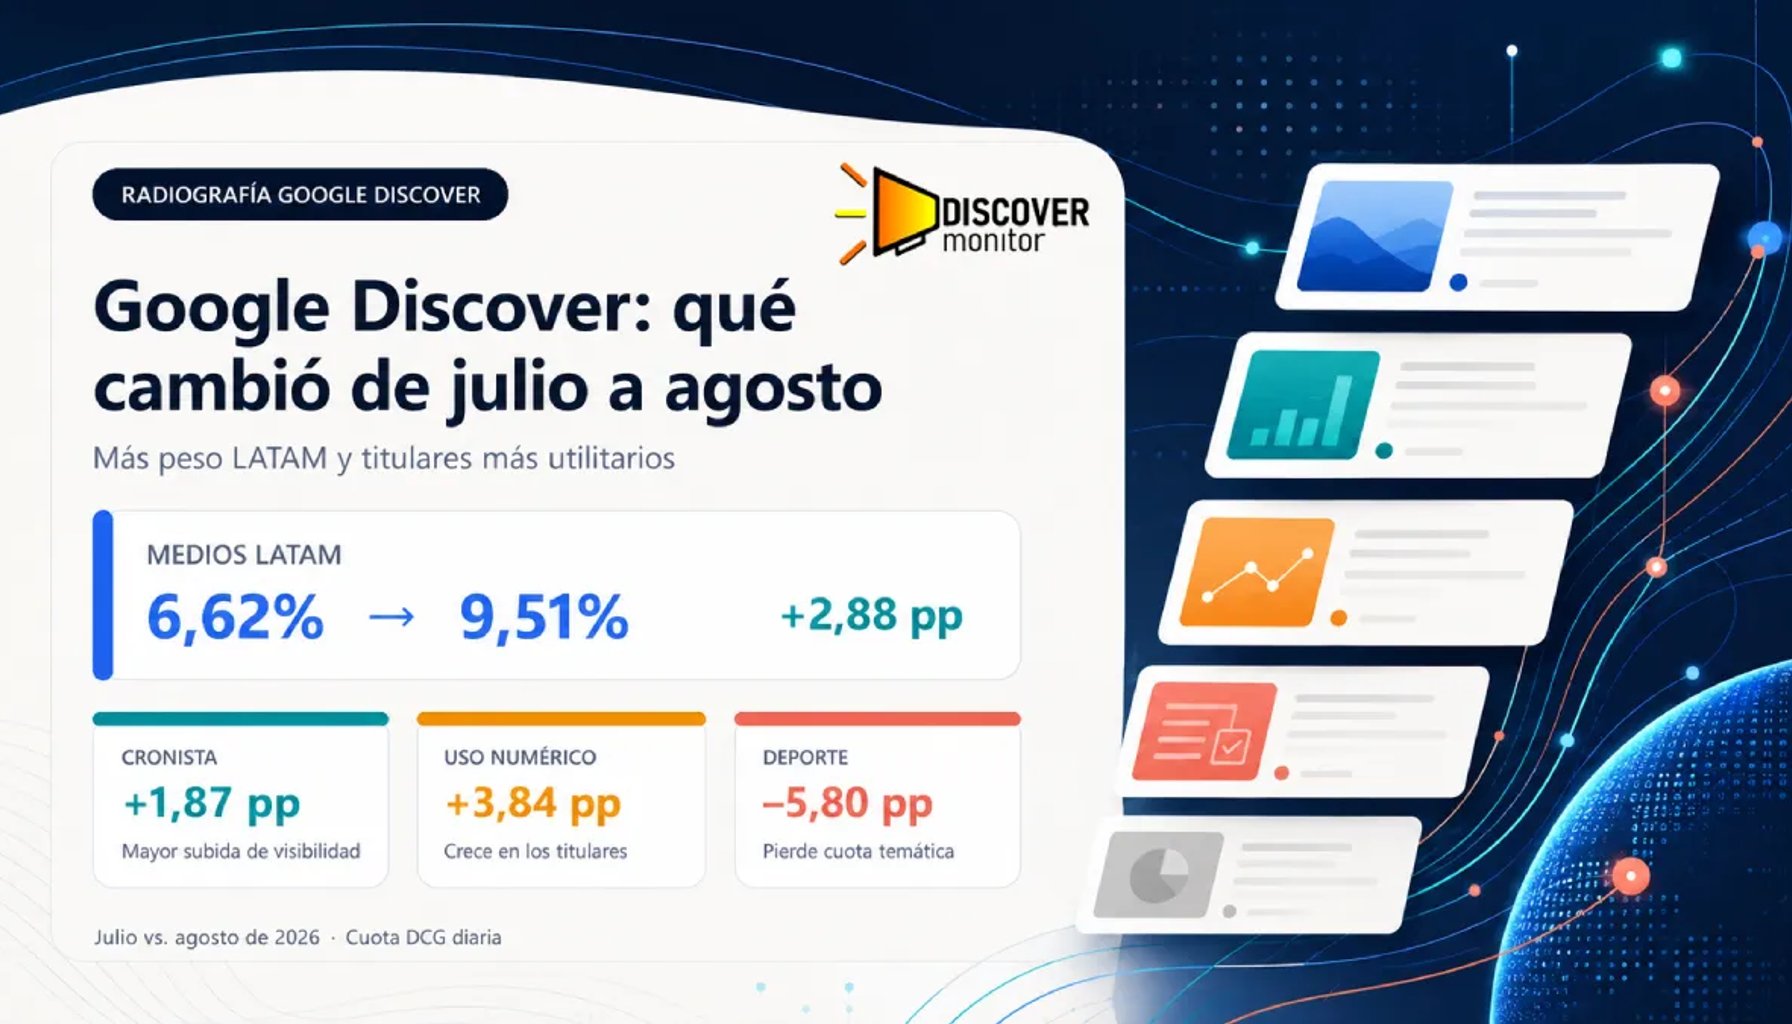
Google Discover’s position-weighted visibility share changed on three fronts at once in August 2026: the weight of sports and politics declined, the presence of consumer, travel, and entertainment content increased, and the footprint of Latin American media outlets grew significantly, especially that of Argentine publishers. The most visible movement among sites was the rise of www.cronista.com, which gained +1.87 pp, increasing from 1.24% to 3.11%. By contrast, x.com lost 2.01 pp, falling from 5.26% to 3.26%.
The editorial shift is also evident in headlines. The use of numbers increased by 3.84 pp; the declarative pattern fell by 3.18 pp; and references to prices, ages, lists, and revelations became more common. These data do not indicate that there is a single “winning formula”; rather, in August, Discover gave greater exposure to pieces offering specific, quantifiable, or practical promises.
1. What was measured
We analyzed all news stories that appeared in Google Discover in August 2026 and calculated volume metrics and comparisons against the July 2026 data already available to us. Each observation receives a DCG weight of 1/log2(position+1): an appearance in a higher position contributes more than one placed further down. We then calculate, for each day, the share of each site, section, topic, or segment relative to the day’s total DCG weight.
2. Measurement: Google Discover visibility winners and losers in August 2026
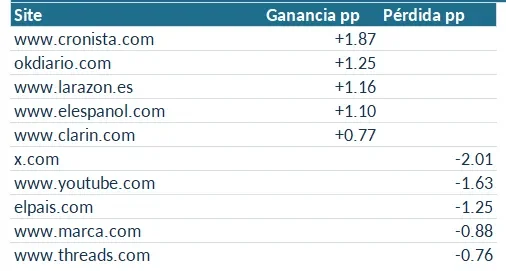
The largest gain was recorded by www.cronista.com: 1.24% → 3.11% (+1.87 pp). It was followed by okdiario.com (+1.25 pp), www.larazon.es (+1.16 pp), www.elespanol.com (+1.10 pp), www.clarin.com (+0.77 pp), and www.elconfidencial.com (+0.75 pp). They did not all start from the same baseline: the relative gains made by Cronista and Clarín are much larger than those of already established leaders.
The largest declines were recorded by x.com (-2.01 pp), www.youtube.com (-1.63 pp), elpais.com (-1.25 pp), www.marca.com (-0.88 pp), and www.threads.com (-0.76 pp). It is unexpected that two social platforms and YouTube should decline simultaneously while news publishers gain ground. This is a descriptive observation; the data do not allow us to attribute it to a change in the algorithm, editorial supply, or user behavior.
3. Measurement: the thematic shift
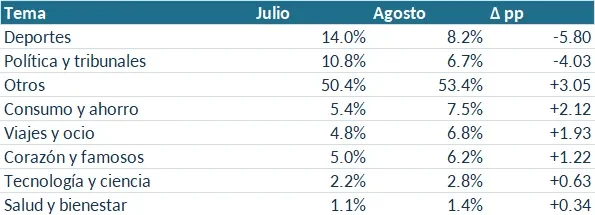
The most pronounced change was in Sports, which fell from 14.01% to 8.21% (-5.80 pp). Politics and courts lost 4.03 pp. By contrast, Consumer affairs and savings gained 2.12 pp, Travel and leisure 1.93 pp, Celebrity news 1.22 pp, and Technology and science 0.63 pp.
The sections reinforce the same interpretation: “watch” and “football” declined by around 1.6 pp, while “travel,” “international,” “society,” and “curiosities” gained ground. The “Other” category grew by 3.05 pp, an important reminder that the topic taxonomy is deliberately compact and leaves some editorial diversity outside specific categories.
4. Interpretation: August was more practical and less news-cycle driven
The combination of consumer affairs, travel, celebrity news, and technology suggests a mix more oriented toward service content and seasonal leisure. The decline in sports (understandable after the 2026 FIFA World Cup) and politics may fit the calendar, but the study does not demonstrate causality. What matters operationally for a newsroom is that August opened up relative space for content promising to meet a specific need—price, travel, savings, age, a list, or verification—while reducing the share of the categories that dominated July.
5. LATAM: strong growth from Argentina
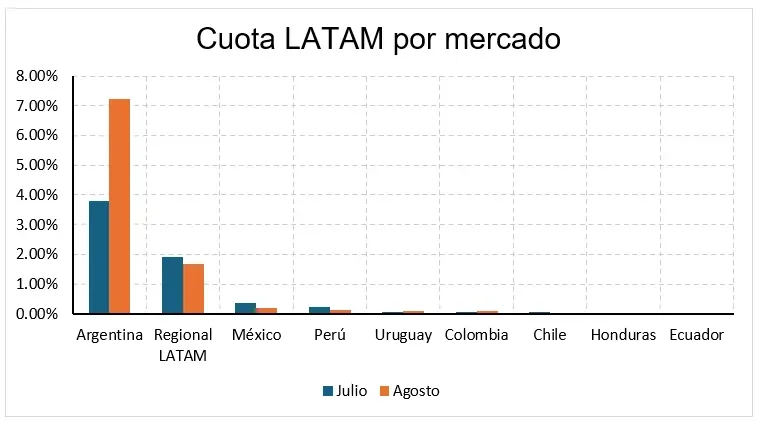
The total share of LATAM media outlets rose from 6.62% to 9.51%, an increase of 2.88 pp, or 43.5% in relative terms. Argentina was the driving force: its share increased from 3.80% to 7.24% (+3.44 pp), propelled by Cronista, Clarín, and La Nación. By contrast, the regional group associated with Infobae lost 0.24 pp, while Mexico and Peru also declined.
We recorded this gain consistently across all cities, reducing the likelihood that the result reflects a peculiarity of a single location. It should be noted that the classification of LATAM media combines geographic suffixes with explicit editorial inclusions.
6. Headline patterns
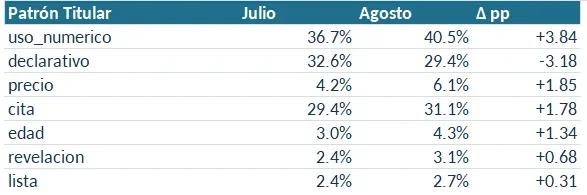
We analyzed 50,134 normalized templates, in which “numeric usage” rose from 36.66% to 40.49% (+3.84 pp). “Price mentions” increased by 1.85 pp; “quotations” by 1.78 pp; and “age references” by 1.34 pp. The “declarative pattern” fell by 3.18 pp.
The decomposition by publisher mix is particularly useful. For numeric usage, approximately 2.69 pp of the change came from internal variations within the media outlets themselves, and 1.20 pp from the publisher mix. For “price”, both components contributed: 1.01 pp internally and 0.87 pp from the mix. We are not only seeing more outlets that use a certain headline style enter the sample; the style is also changing within several publishers.
The exact textual templates are far more concentrated than the general discourse tends to suggest. Most of the patterns showing the largest changes belong to specific editorial routines: passports, saints’ days, prize draws, horoscopes, or cycling.
7. Robustness and controls
We performed 248 checks on the sums of daily shares; all passed, and the maximum error was 4.44e-16. Sports, politics, consumer affairs, travel, and LATAM retained the direction of their change after URL deduplication and after excluding each evaluated site one at a time.
For headlines, we ran 1,000 daily resamples. A blind manual review of 60 headlines achieved 86.3% micro-precision and 74.1% micro-recall. This is sufficiently informative to detect broad trends, but it also warns that some labels do not capture every linguistic variation.
The top 10 concentration barely changed: 45.81% in July and 45.67% in August. The HHI rose slightly, from 0.0290 to 0.0295, while the average daily number of distinct sites fell. The market shifted slightly, but we cannot say that it became radically more concentrated.
8. Limitations
This analysis does not measure traffic, clicks, impressions from real users, or algorithmic causality. Feed position and DCG weighting are useful conventions, not CTR estimates. The topic taxonomy and LATAM classification are editorial rules that may be revised. Headlines may receive multiple labels, and normalized templates may group similar phrases together or separate variants that a human reader would consider equivalent.
The conclusion is that August shifted visibility away from sports, politics, and social platforms toward more practical and leisure-oriented content and Argentine media outlets. It is a consistent and robust change within the sample.