Google Discover changes in July: platforms gain ground and quotes surge
How Google Discover changed in July: more social platforms, more quotes and a shift toward sports
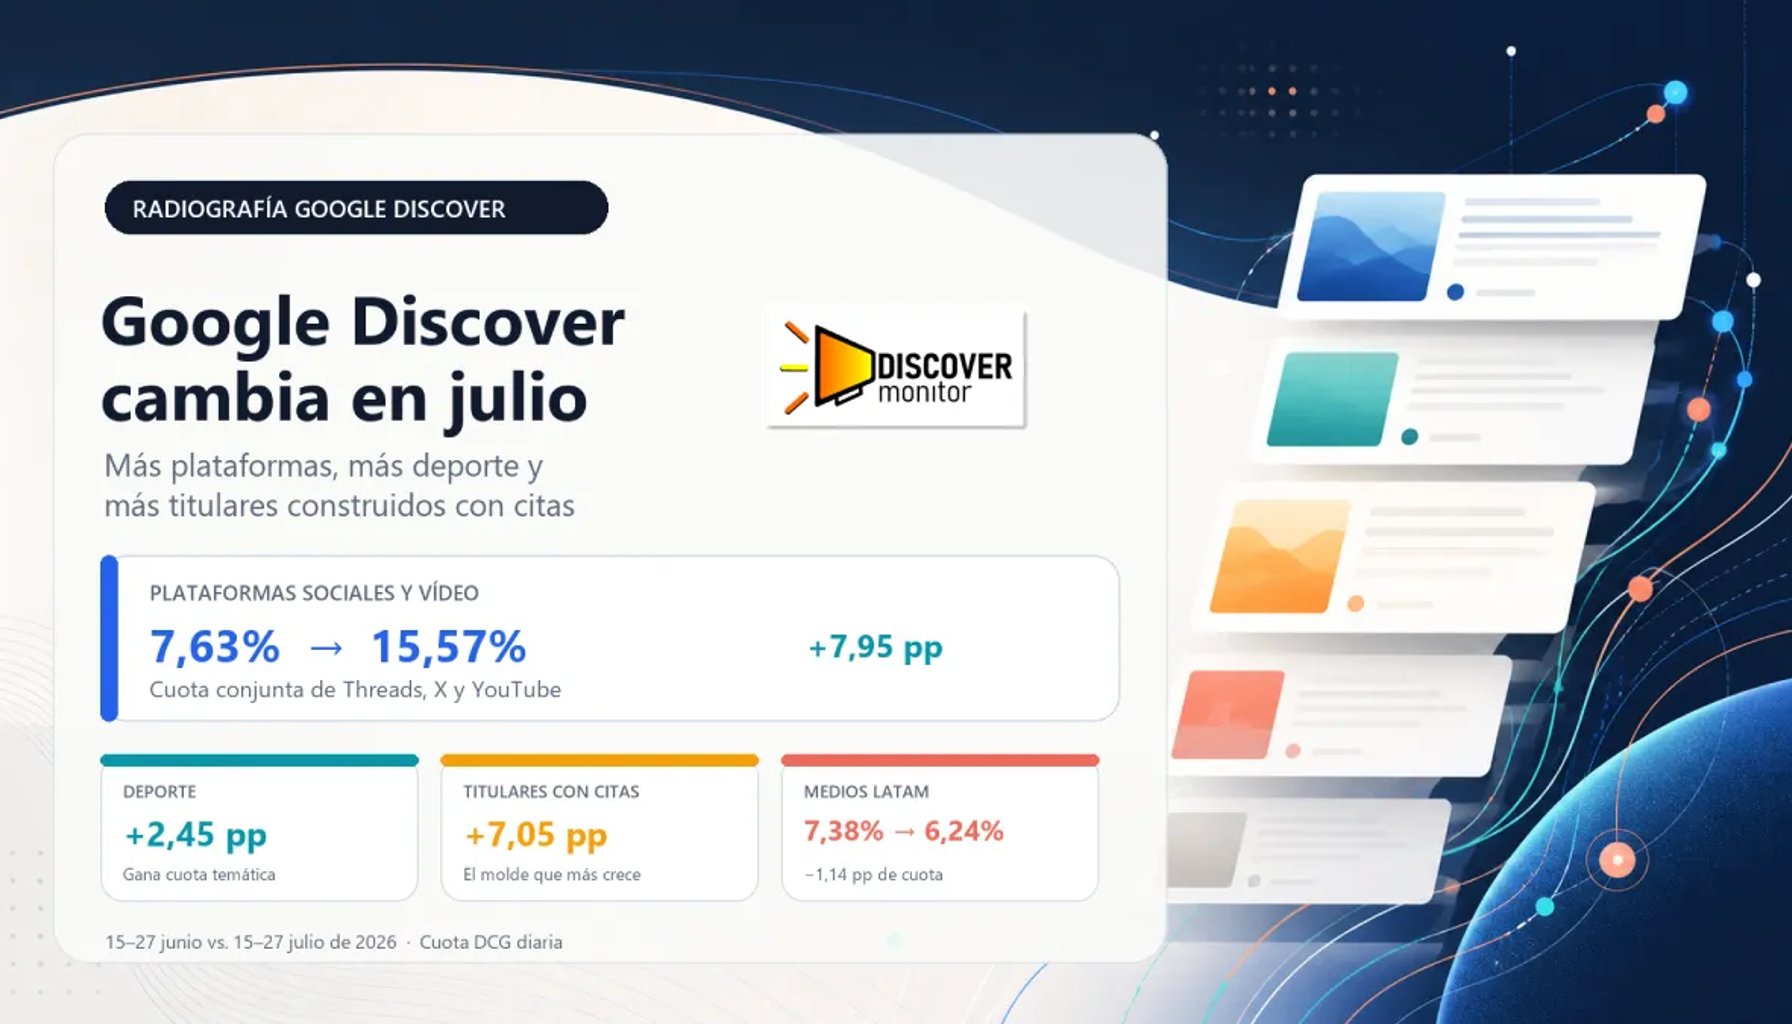
An analysis of appearances in Google Discover shows a significant shift between the second half of June and the first few days of July: Threads, X and YouTube gain visibility, sports displace consumer content, and quotes come to account for nearly a third of the editorial weight of headlines.
Key data
- Comparable period: June versus July 2026.
- Largest increase: Threads, +3.02 percentage points.
- Largest decrease: El Español, −1.57 points.
- Fastest-growing topic: Sports, +2.45 points.
- Fastest-growing format: headlines with quotes, +7.05 points.
What we compared
The central metric is DCG share: the percentage of visibility obtained by each publisher, topic or headline format, with greater weight given to appearances in higher positions on Google Discover.
Each appearance is assigned a weight of:
1 / log2(posición + 1)
The daily share is then calculated and averaged across all days in the period. When an entity does not appear on a given day, its share is considered zero. This means that a day with more records does not, by itself, determine the result.
We are not simply counting headlines. We are estimating how much of the weighted visibility is occupied by each publisher, topic or editorial pattern.
Platforms gain ground over traditional media
The clearest movement in July is the combined growth of social and audiovisual platforms.
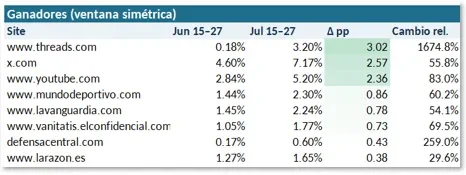
Threads rises from a 0.18% to a 3.20% DCG share, an increase of 3.02 percentage points. It is the largest individual increase in the analysis.
X advances from 4.60% to 7.17%, a gain of 2.57 points, while YouTube rises from 2.84% to 5.20%, representing an additional 2.36 points.
Combined, the three platforms increase from 7.63% to 15.57% of weighted visibility. They virtually double their share and gain 7.95 points in just one comparable month.
The data describe a more hybrid environment: Google Discover is not only distributing pieces published by digital media outlets, but also a much larger proportion of content hosted or distributed through platforms.
This does not allow us to claim that there has been a specific algorithm change. The variation may reflect the available published content, the news cycle during the period, distribution decisions, algorithmic changes or a combination of factors.
Winners and losers among publishers
Outside the major platforms, several publishers are increasing their presence.
Mundo Deportivo rises from 1.44% to 2.30%, a gain of 0.86 points. La Vanguardia climbs from 1.45% to 2.24%, +0.78 points, and Vanitatis advances from 1.05% to 1.77%, +0.73 points.
Other standouts include:
- Defensa Central: +0.43 points.
- La Razón: +0.38 points.
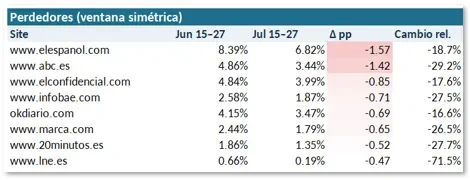
At the other end of the spectrum, El Español retains a significant position but sees its share fall from 8.39% to 6.82%, a decline of 1.57 points.
ABC falls from 4.86% to 3.44%, representing −1.42 points. It is followed by:
- El Confidencial: −0.85 points.
- Infobae: −0.71 points.
- OKDIARIO: −0.69 points.
- Marca: −0.65 points.
- 20minutos: −0.52 points.
Losing share does not necessarily mean that a publisher posted less content or that all its content performed worse. It means occupying a smaller portion of the available weighted visibility.
A publisher may maintain its volume and still lose ground if other players grow more or secure better positions.
Sports gain ground, while consumer and savings content declines
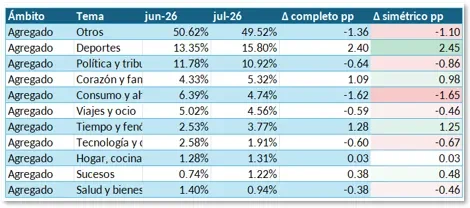
The main thematic shift is in Sports, which rises from 13.35% to 15.80%, an increase of 2.45 points.
Among the emerging clusters following the end of the 2026 FIFA World Cup are formats related to the Tour de France:
- “Here is the Tour de France general classification today after stage…”
- “Tour de France 2026: profile, route, time and where to watch stage…”
These examples do not prove that the Tour explains all the growth in sports, but they do reveal a repetitive, recognizable family of headlines that gains prominence during the period.
Also increasing:
- Weather and phenomena: from 2.53% to 3.77%, +1.25 points.
- Entertainment and celebrities: from 4.33% to 5.32%, +0.98 points.
- Crime and incidents: from 0.74% to 1.22%, +0.48 points.
Conversely, Consumer and savings falls from 6.39% to 4.74%, a loss of 1.65 points.
Also declining:
- Politics and courts: −0.86 points.
- Technology and science: −0.67 points.
- Health and well-being: −0.46 points.
Deal-related formats lose ground
The decline in consumer content also appears in specific formats.
The pattern:
“Tomorrow, mile-long lines are expected at [store] to get…”
falls from a 0.284% to a 0.045% share, a decline of 0.239 points.
Another similar format:
“Mile-long lines are expected at [store] for…”
disappears in July after accounting for 0.185% in June.
This does not mean that headlines about deals have stopped working in general. The correct conclusion is more limited: those specific formats lost visibility during this window, while sports, weather, and personal or celebrity content grew.
A format does not work in isolation from the editorial calendar. Its performance depends on the topic, the timing and the news content available.
Sections reflect a more hybrid ecosystem
The section labels included in the data reinforce the same trend.
The watch section, associated primarily with YouTube content, rises from 2.84% to 5.19%, a gain of 2.35 points.
The current affairs section gains 1.12 points.
Among the sections that decline are:
- Spain: −1.51 points.
- soccer: −0.98 points.
- society: −0.63 points.
The fact that the soccer section declines while the Sports topic increases is related to the end of the 2026 FIFA World Cup. Topic and section are different dimensions. Sports content can grow through cycling, video, current affairs or other labels.
Concentration barely changes
The combined share of the top five players falls slightly, from 30.89% to 30.68%, a difference of just −0.21 points.
At the same time, the HHI (which measures visibility concentration) rises from 0.0310 to 0.0312.
The two indicators move in different directions, and the changes are minimal. It would not be rigorous to claim that Discover has clearly become more or less concentrated.
The most cautious conclusion is that overall concentration remains virtually stable, although the players occupying that visibility have changed.
Threads, X and YouTube make strong gains, while several traditional publishers lose share. The dominance of the leading players does not expand substantially; their positions are redistributed.
Headlines with quotes surge
The most important stylistic change is not found in questions, lists or calls to urgency. It appears in quotes.
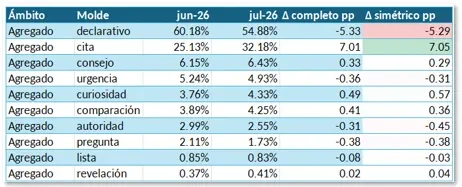
Headlines tagged with this device rise from a 25.13% to a 32.18% weighted prevalence: an increase of 7.05 points.
At the same time, purely declarative headlines fall from 60.18% to 54.88%, a loss of 5.29 points.
Other changes are far more moderate:
- Curiosity: +0.57 points.
- Comparison: +0.36 points.
- Advice: +0.29 points.
- Questions: −0.38 points.
- Authority: −0.45 points.
- Urgency: −0.31 points.
These tags are multilabel: a single headline can contain a quote, cite an authority and offer advice. The percentages should therefore not be added together as though they were mutually exclusive categories.
What the quotes gaining visibility look like
The July examples show that quotes are incorporated into different structures:
- “Pilar Rubio, at 48: ‘I usually get up at 6:30 or 7…’”
- “Lamine Yamal, 19: ‘During my childhood, my mother used to make me a recipe…’”
- “Veterinarians agree: ‘Cats that watch the outdoors from a window…’”
Here, quotes serve several purposes.
In some cases, they provide a recognizable voice. In others, they introduce a personal experience, a recommendation or an authoritative statement. They also create an implicit promise: the reader expects to discover the rest of the statement and its surrounding context.
There is an important nuance: the generic cluster made up solely of an opening quote declines slightly, even though the overall quote family increases by 7.05 points.
The most robust interpretation is that quotes are growing as a cross-cutting device, incorporated into different formats, rather than because a single template dominates the period.
Structures such as the following also appear or gain traction:
- “The love story of [person] and their partner…”
- “[Person]’s hometown, their refuge…”
- “This is [person]’s [place]…”
- “The [date] comes into effect…”
These are formulas that combine a recognizable entity, a specific detail and a descriptive or practical promise.
Latin American publishers lose ground in July
The presence of Latin American publishers in Google Discover declines during the period analyzed. Their combined DCG share falls from 7.38% to 6.24% between June and July, a drop of 1.14 percentage points, equivalent to a relative decrease of 15.4%.
Infobae accounts for much of the decline, losing 0.71 percentage points. TyC Sports also falls, by −0.22 points, as does El Comercio de Perú, by −0.09. By market, the Regional LATAM category falls 0.71 points and Peru loses 0.16.
Not every publisher follows the same direction. El Cronista gains 0.14 points, TN adds 0.13 and Xataka México advances by 0.07. Argentina as a whole manages to improve its share slightly, with an increase of 0.14 points, despite the overall decline in Latin American presence.
For this analysis, 113 Latin American domains were identified using two reviewable criteria: geographic extensions such as .com.ar, .com.co, .com.mx, .cl or .pe, and editorial inclusions for publishers whose domains do not clearly reveal their market, such as Infobae, Clarín, Semana or TyC Sports. Ambiguous .com domains were not classified automatically.
The result does not indicate a general withdrawal of LATAM publishers from Discover, but rather a loss of weight within this specific sample. The decline is concentrated among certain publishers, while others, especially Argentinian ones, gain visibility. This reinforces the need to analyze the Latin American segment by outlet and market, rather than as a homogeneous category.
Three findings worth remembering
- Threads, X and YouTube nearly double their combined share, rising from 7.63% to 15.57%.
- Concentration remains stable, despite the major shift between platforms and publishers.
- Quotes increase by 7.05 points, but are spread across various structures rather than a single template.
What newsrooms can do with this data to improve their audiences
The analysis suggests four lines of action.
1. Develop a separate strategy for Discover
Producing more pieces is not enough. Position, daily consistency, topic and the type of source capturing visibility all matter.
Publishers should assess Discover with specific metrics instead of relying solely on sessions, impressions or the number of pieces published.
2. Treat platforms as genuine competitors
Threads, X and YouTube are not marginal players during this window. They compete directly for a significant share of visibility.
Editorial monitoring should include not only news domains, but also accounts, channels and audiovisual formats.
3. Experiment with informative quotes
The growth of quotes does not mean that any phrase in quotation marks will work.
The most interesting structures combine the quote with specific information: age, experience, recommendation, routine, conflict or recognizable authority.
The quote should add narrative value, not be used as empty packaging.
4. Analyze formats alongside the calendar
Tour-related formulas gain prominence during the competition. Those associated with deals and lines lose ground during this period.
The format matters, but the editorial context matters even more.
Limitations of the analysis
Topics and formats were classified using auditable rules. This makes it possible to review the criteria, although it does not eliminate every ambiguity.
The “Other” topic category still accounts for 49.52% of the share. The taxonomy therefore prioritizes certain broad areas, but does not seek to classify all content exhaustively.
The clusters normalize figures, quotes and entities to detect similar openings. They identify structural repetition, not semantic equivalence: two headlines may share a format while addressing entirely different subjects.
Report conclusions
- In the analyzed window, Google Discover changes less in its overall concentration than in the composition of who gains visibility and how headlines are constructed.
- July brings more platforms, more sports and many more headlines based on direct quotes.
- The growth of Threads, X and YouTube does not eliminate the role of traditional publishers, but confirms that competition within Discover is no longer limited to other publishers.
- At the same time, the rise in quotes shows a stylistic evolution: headlines increasingly seek to draw on voices, experiences and specific statements.
- For newsrooms, the lesson is not to copy a formula mechanically. It is to observe which combination of topic, timing, source, position and structure is capturing visibility, and to test editorial hypotheses with their own data.