Empty Shelves or Lost Keys: Why the Way You Measure Google Discover Does Not Tell You What to Fix
If you measure Google Discover the way most editorial teams do, you probably look at the same dashboard: clicks, impressions, monthly trends, and a comparison with the previous month. Based on those data, the conclusion is usually immediate: traffic is either rising or falling.
That approach has a problem: it reduces several distinct causes to a single symptom. A drop in clicks may occur because your content is no longer eligible for the feed. It may be because the content remains eligible but is not retrieved for the users to whom it would be relevant. Or it may be because the content does appear, but not as a standalone card; instead, it is cited within an AI-generated summary. These are three different problems with different solutions, yet the aggregate report presents them as though they were the same.
A recent Google Research paper examines a similar problem in another context: the memory of language models. Although it does not address Google Discover directly, its diagnostic framework can be highly useful for improving how we measure editorial presence in the feed.
The Paper: “Empty Shelves or Lost Keys?”
In August 2026, Nitay Calderon and Gal Yona published a Google Research paper titled Empty Shelves or Lost Keys? Recall Is the Bottleneck for Parametric Factuality, together with an open benchmark called WikiProfile containing 2,150 facts extracted from Wikipedia.
The starting question is simple: when an LLM gives a factually incorrect answer, is it because it never learned the fact or because it cannot retrieve what was stored?
The usual accuracy metric combines both cases, but the causes have very different implications. If the model does not have the fact represented in its parameters, the problem concerns learning. If the fact is represented but the model cannot retrieve it, the problem concerns access.
To distinguish these situations, the authors propose an approach called knowledge profiling, which separates three states:
Encoding: the fact is represented in the model's parameters.
Recall: the model can retrieve and generate it without external cues.
Recognition: the model identifies the correct fact when it is presented among several alternatives.
The central finding is significant. In frontier models such as Gemini 3 Pro and GPT-5, encoding is nearly saturated: approximately 95-98% of facts are encoded. However, those same models fail to retrieve between 26% and 34% of those facts directly. With reasoning enabled, the error rate decreases, but it does not disappear.
In other words, the bottleneck is not necessarily what the model knows, but what the model can access.
Two secondary findings are particularly relevant to the editorial analogy.
First, less frequent facts are encoded almost as often as popular ones. The difference between the long tail and the head is small in encoding, but much larger in recall. This suggests that the problem with less frequent topics is not that they are absent from the model, but that they are more difficult to retrieve.
Second, reasoning retrieves between 40% and 65% of the facts that are encoded but cannot be retrieved directly. It does so precisely in the areas where direct recall is weakest.
How This Translates to Google Discover
Before applying the analogy, it is important to state its limits clearly.
This paper does not study Google Discover. It does not analyze recommendation systems, document retrieval, or web pages. It measures the parametric memory of language models in a closed-book setting. Therefore, any application to Discover is a methodological analogy, not evidence that Google's internal feed works this way.
That said, the analogy makes sense for one specific reason: the structural problem is similar. A system that apparently “does not know” something may be failing at very different points in the process, and an aggregate metric cannot identify the point of failure.
Moreover, with the introduction of AI-generated summaries on some Discover surfaces, the comparison is no longer purely theoretical. According to previous coverage of the topic, there are scenarios in which a generative model selects and cites sources within the feed. If that happens, measuring clicks on standalone cards is no longer enough: we need to distinguish between appearing as a card, appearing as a citation, and not appearing at all.
In operational terms, the translation would be as follows:
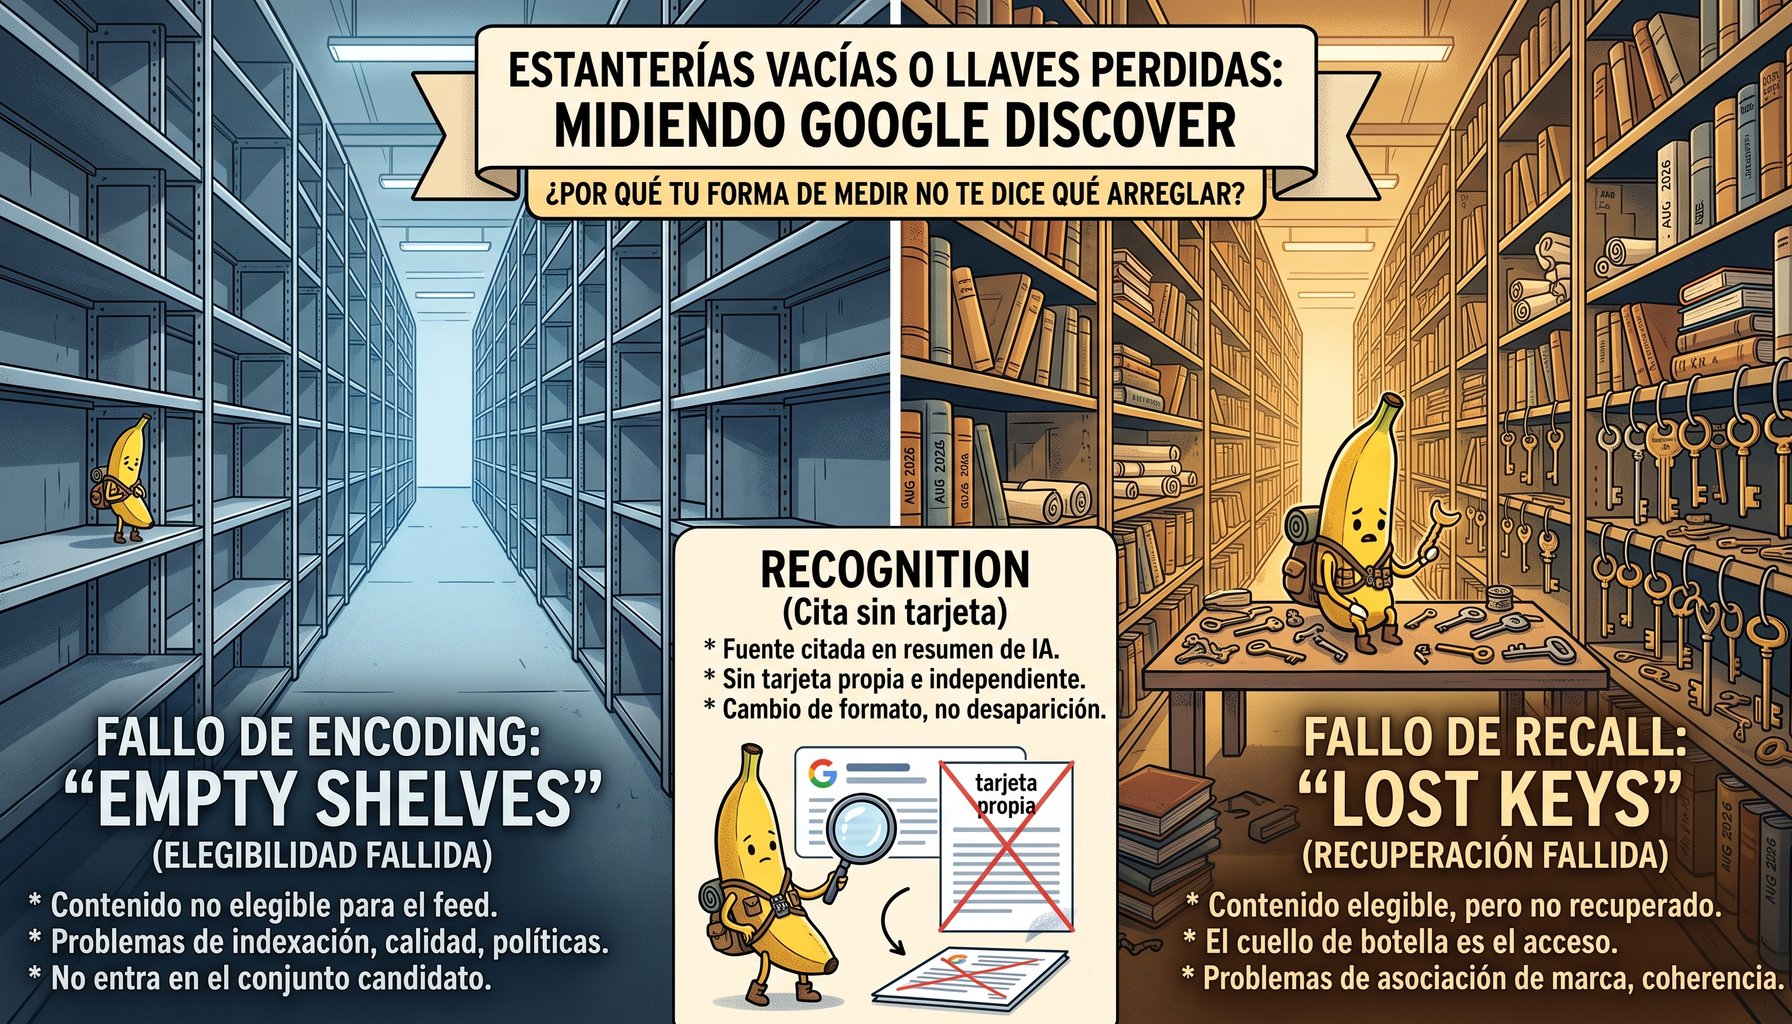
| Paper State | Discover Equivalent | What It Means |
|---|---|---|
| Encoding failure | Eligibility failure | Your content does not enter the candidate set because of indexing issues, policy violations, image quality, publisher signals, or technical conditions. |
| Recall failure | Retrieval failure | Your content is eligible, but it is not retrieved for the user's specific interest. |
| Recognition without recall | Cited without a card | You appear as a source or logo within a grouped summary, but not as a standalone card with its own link. |
That third case is especially relevant now. If you measure only clicks, a shift from a standalone card to a citation within a summary may be interpreted as a loss of visibility. But it is not necessarily disappearance; it is a change in format. And it requires a different response.
Five Changes to Measure Google Discover More Effectively
1. Change the Unit of Analysis: From URL to Entity
The paper's central move is to stop evaluating isolated answers and start profiling facts. In an editorial context, the equivalent is to stop scoring isolated URLs and start working with entities, topic clusters, or coverage areas.
Google Discover does not recommend content like a traditional search engine. It does not operate primarily from an explicit query, but from the user's interests. If your unit of analysis is the URL, you are measuring the result of a small and variable sample. If your unit is the entity (a topic, a club, a company, a regulator, a country, or a vertical), you can ask a much more useful question: of all the stories published about this entity this week, in how many does my publication appear?
This turns the measurement of a one-off event into a signal of editorial position.
2. Restore the Denominator
The Search Console report shows you the numerator: how many times your card was shown, how many clicks you received, and how many impressions you generated.
But it does not show you the full denominator: how many opportunities existed in your vertical, how many stories competed for that interest, how many publications covered the topic, and how strongly they did so.
This missing denominator is one reason why changes in Discover are experienced as an unpredictable phenomenon. If you do not know how many opportunities existed, you cannot distinguish between a real loss of visibility and an environment in which there were simply fewer stories, fewer competitors, or less overall interest.
The denominator must be constructed outside the dashboard: publication volume in your vertical, the number of publications covering the topic, the intensity of the conversation, the topic's relevance, and the distribution of formats. Without that contextual layer, the click metric becomes difficult to interpret.
3. Segment by Popularity, Not Just Performance
One useful way to apply the paper's framework is to divide your clusters into head and long-tail cohorts. Do not look only at the topics that already perform well, but also at topics where your coverage could hold a sustainable position even if it is less obvious.
The paper suggests that the difference lies less in whether the fact is present than in how easily it can be retrieved. In Discover, this could translate as follows: if your appearance rate for head topics is competitive but falls far below that of other publications for more specific or niche topics, the problem may not be your content, but your brand's association with those topics.
If so, the answer is not necessarily to publish more, but to strengthen the relationship between your publication and those coverage areas. This may involve sustained coverage, consistent naming, deeper subject-matter coverage, a high-quality archive, specialist correspondents, or a stronger presence in conversations where your publication should appear.
4. Separate Share of Card from Share of Citation
Do not use a single metric to capture presence in the feed. With generative AI coming to Google Discover, two different metrics are now emerging:
Share of card: the percentage of stories in the cluster where you appear as a standalone card with a direct link to your content.
Share of citation: the percentage of stories where you appear as a source within a grouped summary or as a secondary reference.
The two metrics reveal different things.
The first measures actionable visibility: the user can see your brand and click directly through to your story. The second measures source recognition: your publication is present as a reference, but it is not necessarily given the main card.
A publication whose citation share rises while its card share falls may be experiencing a shift in format. It is not disappearing entirely, but it is losing the more visible format. That deserves its own diagnosis: source authority, editorial recognition, external corroboration, consistency of coverage, and brand strength.
5. Measure With and Without Reasoning
This is one of the paper's most useful points and also one of the least commonly applied.
If reasoning retrieves a significant proportion of facts that are encoded but not directly accessible, then your publication's visibility on conversational surfaces may depend on how the model is prompted.
An AI visibility audit that measures with only one question, in one mode, or with one wording provides an incomplete picture. It is better to ask the same thing using different approaches.
For example:
Direct question: What does [your publication] cover?
Reverse question: Which publications cover [your vertical] in Spain?
Comparative question: Which publications regularly report on [entity] in [sector]?
Retrieval question: Where would I find recent information about [topic]?
It is also worth varying the mode: with simple reasoning, without explicit reasoning, with brief context, and with more extensive context.
If your publication appears in response to the direct question but not the reverse one, or if it appears only with reasoning and not without it, that does not mean your brand is absent. It may mean that it is encoded, but in a fragile way. That is a different diagnosis (and, in many cases, a more recoverable one) from complete absence.
Which Action Corresponds to Each Diagnosis
Not every loss of visibility in Discover can be resolved in the same way. This framework helps you distinguish the causes more clearly.
If the Problem Is Eligibility
The diagnosis points to technical factors, policy issues, or publisher signals.
Possible causes:
indexing issues;
low-resolution or poorly optimized images;
incomplete compliance with Discover guidelines;
weak source or authorship signals;
content that does not meet feed requirements;
structural changes that affect how the card is displayed.
Here, the response is both technical and editorial: improve signal quality, correct indexing errors, review images, strengthen authorship, and verify that the content meets the eligibility requirements.
If the Problem Is Retrieval
The diagnosis suggests that your content may be eligible but is not being retrieved for interested users.
Possible causes:
fragmented coverage
inconsistent treatment of an entity
lack of a relevant archive
limited external corroboration
a weak association between your publication and the topic
stronger competition in that cluster
Here, the answer is not simply to publish more, but to publish in a more sustained and recognizable way. The goal is to build a clear relationship between your brand and the topic through regular coverage, depth, context, data, analysis, and participation in conversations where your publication should be a reference.
If the Problem Is Recognition Without a Card
The diagnosis indicates that your publication appears, but not as the main card.
Possible signs:
citations within grouped summaries increase
direct clicks to your story decrease
your publication appears as a source, but not as a destination
other publications capture the main card
the audience recognizes the coverage but does not access your content directly
Here, the response should address source authority and the direct relationship with the audience. This may involve strengthening the brand, building a community, improving distribution beyond the feed, increasing editorial corroboration, and making the relationship between your publication and the topic it covers more visible.
A Final Note of Caution
This framework is borrowed. There is no public evidence that Google Discover internally implements the three states described in the paper, or that its recommendation system explicitly distinguishes between encoding, recall, and recognition. Anyone claiming that it does, without presenting evidence, is probably extrapolating the paper's conclusions too far.
What this approach does provide is measurement discipline. It forces us to ask questions that are not usually asked:
What is the actual denominator?
Are we measuring cards, or citations as well?
Is our problem one of eligibility, retrieval, or format?
On which topics are we losing position, and on which are we merely moving to a different surface?
Does our brand appear only when the question is phrased in a very specific way?
That is valuable even if the analogy with the paper does not align perfectly with Google's actual architecture.
The paper is published on arXiv under identifier 2602.14080 and has an accessible overview on the Google Research blog. It is worth reading in full, not only to understand LLM memory, but also to assess how much of what is being written about it in the publishing industry genuinely reflects the paper's content.